The information shown on your report dashboard starts globally – with the aggregate metrics of all of your influencers – and gets more specific as you scroll down. Keep reading to find out what information is displayed in each section.
Adjusting Your Dashboard View
Your Dashboard Overview gives you the option of sorting information by Publication type, Publication date, or Data source (i.e., Automatic or Manual Analysis). We want to see all of our data, so we’ve left our filters like this:
![]()
Main KPIs
This section gives an overview of the KPIs (Key Performance Indicators) of all the influencers included in this report. This is aggregate data, so the number of followers represents the sum of each influencer’s followers.
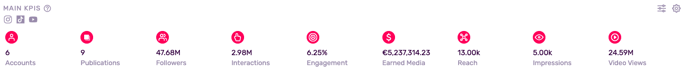
Tip: Learn about the most common influencer marketing KPIs in the Influencity Glossary.
Interactions Summary
This is the global number of interactions for the posts in this report. For example, as this report includes publications from Instagram, TikTok, and YouTube, the total number of likes represents the likes from all 3 networks.
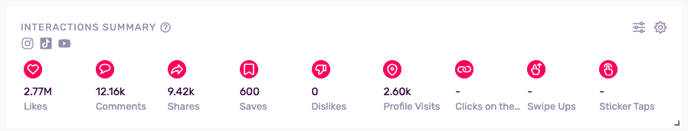
Note: Metrics such as Clicks on the link, Swipe ups, and Sticker taps are private. For this information to be included in your report, you’ll need to ask an influencer for their private post insights and enter them manually.
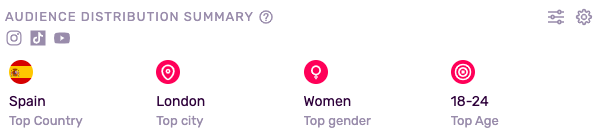
Audience Distribution Summary
This shows the country and city where the highest percentage of your audience is located as well as the top gender and age. This information is based on the audience reach of each one of your influencers.
Tip: Customize the information that appears in each section of your report by clicking the two widgets on the top right of each section.
Costs
Influencity takes the publication cost you included for a post and uses it to calculate the following values for both your publications and your influencers:
To add cost information to a publication, go to Publication data, click on the image thumbnail, and scroll down to Cost.
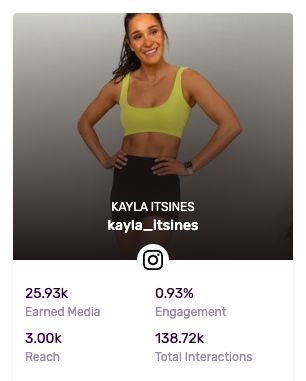
Top Profiles
These are the best-performing profiles and their stats. This side-by-side comparison of your top profiles helps you see which influencers performed best within this campaign.
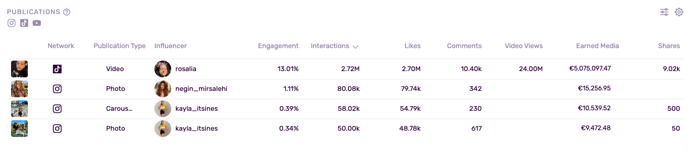
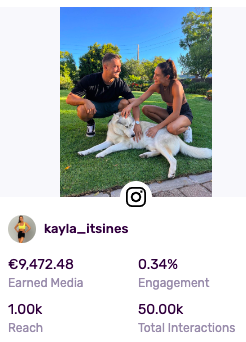
Top Publications
These are the best-performing publications and their data. By comparing individual post data, you can identify what made certain publications more successful than others.
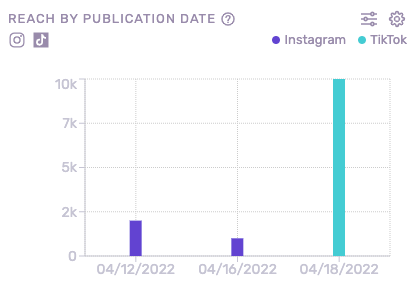
Reach by Publication Date
Use this figure to see if uploading content on certain days affects the number of unique users you can reach. This metric is only available for Instagram and TikTok.
Reach Split
This chart shows how much of your reach can be attributed to posts on Instagram vs. TikTok.
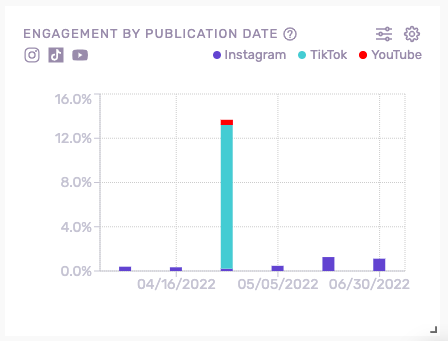
Engagement by Publication Date
Compare the engagement (number of interactions divided by the number of followers) on different days and across social networks.
In our sample report, we can see our Instagram engagement is normally just under 1%. However, around the end of April, one of our influencers must have jumped on a TikTok trend which sent their engagement to over 12%.
Engagement Split
Compare your average engagement on YouTube with that on Instagram and TikTok.
Interactions by Publication Date
Compare the total number of interactions on different days and across social networks
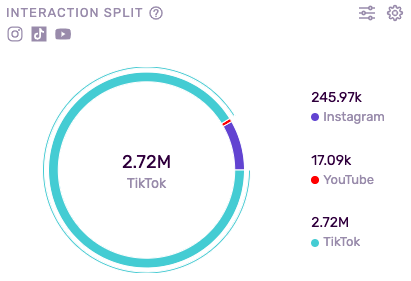
Interactions Split
The number of interactions segmented by social network. In our sample report, we can see that the vast majority of our interactions come from TikTok publications.
Learn from your success on one social network and see what can be applied to repeat this success on others.
Impressions by Publication Date and Impressions Split
See how many times your content was shown to users and on what date. This metric is only available for manual analysis on Instagram.
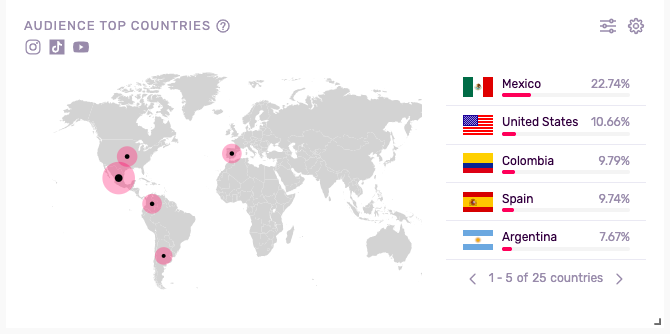
Audience Top Countries
See the physical distribution of the followers who viewed your publications. This particular group of publications performed well with users in the US and Latin America.
Audience Top Cities
The top cities where your publications were viewed (Instagram only).
Audience Gender
View the percentage of your audience that is male and female.
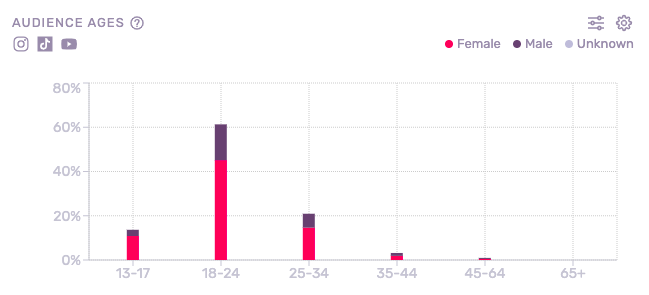
Audience Ages
The ages of your audience segmented by gender.
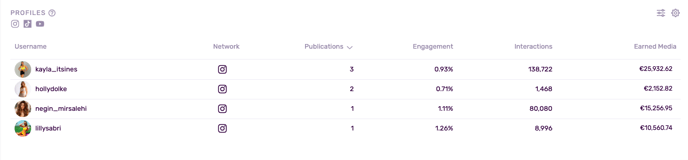
Profiles
An overview of the influencers whose publications are included in this report as well as their engagement rate, interactions, and Earned Media Value (EMV).
Publications
An overview of the individual publications that are included in this report.