Application Programming Interface (API)
Influencer Relationship Management (IRM)
Key Performance Indicators (KPIs)
Application Programming Interface (API)
An API is a software intermediary that allows two applications to “talk” to each other. In the case of Influencity trackings, the API gathers information about specific posts and conveys this information to Influencity, which then compiles this data into your reports.
If the digital world were a restaurant, the API would play the role of the server who takes customers' orders and communicates them to the kitchen. The action is completed when the waiter delivers the response (your meal) back to you.
Automatic Analysis
This refers to an action done in the Reports product when you enter a publication URL and Influencity automatically extracts all the post’s public performance and audience data and adds it to your report. Learn about the 3 ways to gather data from influencer posts here.
Bot
This is a computer program that is designed to mimic human interaction online. Bots are usually created in large batches and are used to automate certain tasks. On social media networks, this includes following profiles and leaving likes and comments on posts.
As bots are not useful to your influencer marketing strategy, it’s best to avoid profiles with lots of bot followers. How do you know who has bot followers? Check out our follower quality metric for more information.
Clicks on Link
How many times users click on the link that you’ve included in a post.
Cost per Acquisition (CPA)
The cost to your brand for each new customer, sign-up, or sale. For example, if you pay $1,000 to sponsor a post with an Instagrammer and this campaign results in 50 conversions, then your CPA is $20 (1,000/50).
Cost per Click (CPC)
The price you pay for each click or visit to your site. This is also known as Pay per Click (PPC).
Cost per Engagement (CPE)
The price your brand pays for each interaction (also known as Cost per Interaction). This includes likes, comments, shares, etc. To calculate this, just divide the total amount spent by the number of measured engagements. For example, if you spend $10,000 for 5,000 engagements, your CPE will be about $2
CPE is a low-risk way of ensuring your ads reach your intended audience as you only pay when they engage with this content. When a user is presented with sponsored content they either engage with it, making the ad a success, or ignore it, meaning you don’t have to pay as there was no interaction.
Cost per Install (CPI)
What your brand pays each time a customer downloads its app.
Cost per Mille (CPM)
The cost to your brand for every 1,000 impressions (times your content was shown to viewers).
Cost per Post (CPP)
The price you pay for each post, story, video, or carousel.
Cost per Reach (CPR)
Total influencer cost divided by total reach (times unique users viewed your content).
Earned Media Value (EMV)
This is a metric offered by Influencity to help you compare influencers based on their advertising value. It’s based on the interactions (likes, comments, etc.) that influencers receive on their posts. For example, if influencer A has an EMV of $1,000 and influencer B has an EMV $1,500, the organic ad value of influencer B is $500 higher than influencer A, and thus a better investment for your brand.
Warning: EMV is not an indication of how much you should pay to engage with this influencer. Read more about this metric here.
Engagement Rate
This is the total number of interactions (likes, comments, etc.) divided by an influencer’s total number of followers. This number is useful as it puts the number of interactions into context with the number of followers.
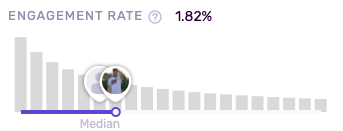
Tip: To help you understand an influencer’s engagement rate, Influencity provides this metric both as a number and as a comparison to other influencers. You can view this metric and more in your IRM.
Impressions
This is the number of times your content (i.e., a story, post, or video) was shown to users, regardless of if they clicked on it or not. A viewer doesn’t have to interact with your content for it to count as an impression, and it’s possible for one user to cause multiple impressions if a piece of content is shown to them various times.
In a perfect world, followers would interact with your sponsored content every time it appears in their feed. Unfortunately, this is not the case. For this reason, it’s common for impressions to be higher than reach.
Note: While reach is the number of unique interactions, impressions are the total number of times your content could have been viewed.
Influencer
An influencer refers to the actual person you will be interacting with through your IRM. Each influencer may have different profiles across Instagram, TikTok, or YouTube.
Influencer Relationship Management (IRM)
This is a strategy for managing your interactions with influencers and is inspired by Customer Relationship Management (CRM). An IRM tool allows your brand to form strategic relationships with content creators and streamline the process of finding, contracting, and managing influencers.
In the Influencity IRM, you can view a profile’s detailed metrics, integrate your email to engage with influencers through the platform, save additional contact information, leave notes and pricing details on each influencer, and much more.
Key Performance Indicators (KPIs)
KPIs are a way to measure performance and include targets that you should shoot for, milestones that gauge your progress, and insights that help you make better decisions regarding Influencer Marketing. There are 2 types of KPIs in influencer marketing:
- Hard KPIs - quantitative measures such as follower growth, average engagement, and follower quality.
- Soft KPIs - qualitative measures such as the ability to reach your target audience and how your brand is perceived.
Manual Analysis
This way of gathering publication data requires users to request influencers’ private post insights and add them to the platform manually. The advantage of manual analysis is that it lets you add insights from Instagram stories and reels to your reports.
Organic Traffic
This refers to visitors who land on your website from unpaid sources, not from ads. Think of it as free traffic, as you are not directly paying for an ad to draw people in.
Profile
This is an account that an influencer opens. For example, one influencer might have an Instagram profile, a TikTok profile, and a YouTube channel. You can merge all 3 and associate them with an influencer in your IRM.
Reach
Reach is the number of unique users who viewed your content. By unique, we mean that each user is only counted once, even if this content is shown to them multiple times.
Return on Investment (RoI)
A way of measuring performance that evaluates the effectiveness of your investment. For example, if you invest 5,000 in an influencer marketing campaign, you’ll want to measure how well it performed in order to optimize your strategy.
In the Influencity Reports product, you can evaluate your RoI at the campaign, social network, influencer, and publication level. Keep reading to find out more.
Social Listening
Also known as Social Media Monitoring, Social Listening is literally using technology to “listen” to what is being said about a company, individual, or brand on the internet. This is good to know because if a brand doesn’t recognize what is being said about them and their industry, it’s difficult for them to connect with their audience or potential customers. Just like in a face-to-face conversation, careful Social Listening gives you important information and allows you to formulate a response – in this case, a relevant and dynamic marketing strategy. At the moment, Influencity does not offer a social listening feature.
Sticker Taps
This is one of the fields you’ll see when using manual analysis to record Instagram story performance in the Reports product. It refers to the number of times users tap on the location, hashtag, mention, or product stickers in your story.

Swipe Ups
This is a private metric that an influencer can share with you to add to a report. As the name suggests, this is when users swipe up to see the link that was included in the story.
Instagram doesn’t offer many options for adding links to posts, and the bio section is best used for landing pages. Due to this, swipe ups are a popular way for companies to give users direct access to the product they are advertising.